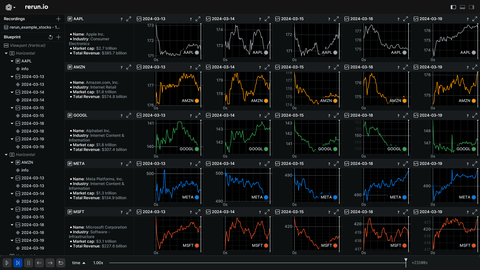
Stock charts
This example fetches the last 5 days of stock data for a few different stocks. We show how Rerun blueprints can then be used to present many different views of the same data.
pip install -e examples/python/blueprint_stocks
python -m blueprint_stocks
The different blueprints can be explored using the --blueprint flag. For example:
python -m blueprint_stocks --blueprint=one-stockAvailable choices are:
auto: Reset the blueprint to the auto layout used by the viewer.one-stock: Uses a filter to show only a single chart.one-stock-with-info: Uses a container to layout a chart and its info documentone-stock-no-peaks: Uses a filter to additionally remove some of the data from the chart.compare-two: Adds data from multiple sources to a single chart.grid: Shows all the charts in a grid layout.