3D line mapping revisited
This example is a visual walkthrough of the paper "3D Line Mapping Revisited". All the visualizations were created by editing the original source code to log data with the Rerun SDK.
Visual paper walkthrough visual-paper-walkthrough
Human-made environments contain a lot of straight lines, which are currently not exploited by most mapping approaches. With their recent work "3D Line Mapping Revisited" Shaohui Liu et al. take steps towards changing that.
The work covers all stages of line-based structure-from-motion: line detection, line matching, line triangulation, track building and joint optimization. As shown in the figure, detected points and their interaction with lines is also used to aid the reconstruction.
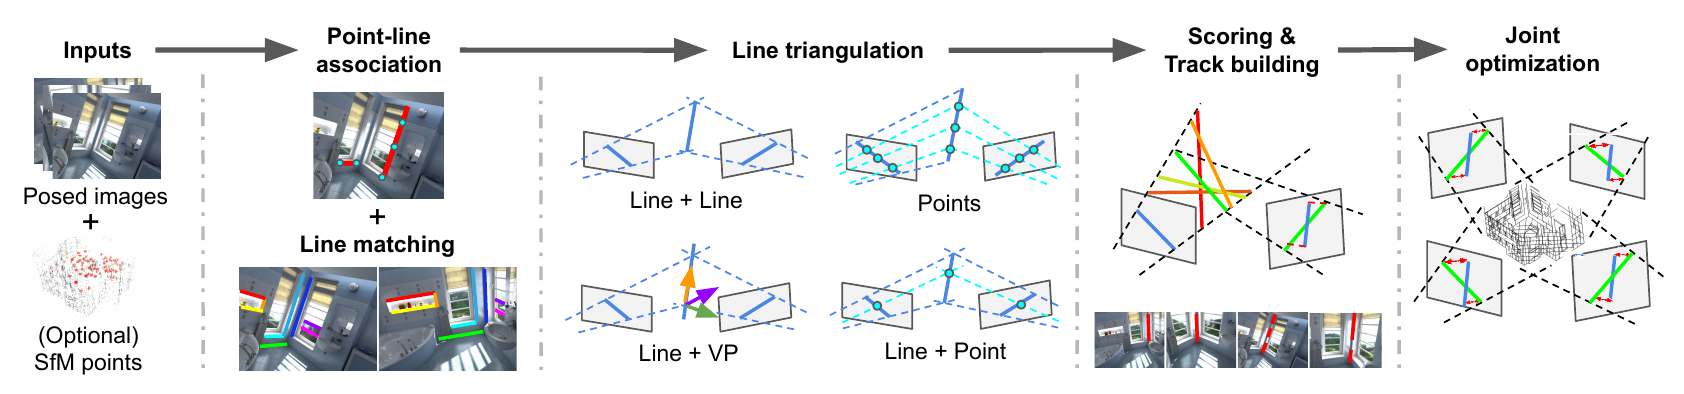
LIMAP matches detected 2D lines between images and computes 3D candidates for each match. These are scored, and only the best candidate one is kept (green in video). To remove duplicates and reduce noise candidates are grouped together when they likely belong to the same line.
Focusing on a single line, LIMAP computes a score for each candidate (the brighter, the higher the cost). These scores are used to decide which line candidates belong to the same line. The final line shown in red is computed based on the candidates that were grouped together.
Once the lines are found, LIMAP further uses point-line associations to jointly optimize lines and points. Often 3D points lie on lines or intersections thereof. Here we highlight the line-point associations in blue.
Human-made environments often contain a lot of parallel and orthogonal lines. LIMAP allows to globally optimize the lines by detecting sets that are likely parallel or orthogonal. Here we visualize these parallel lines. Each color is associated with one vanishing point.
There is a lot more to unpack, so check out the paper by Shaohui Liu, Yifan Yu, Rémi Pautrat, Marc Pollefeys, Viktor Larsson. It also gives an educational overview of the strengths and weaknesses of both line-based and point-based structure-from-motion.