Minimal example
Generates a 3D colored cube and demonstrates how to log a point cloud.
Straightforward example from the Quick Start guide to generate a 3D colored cube and demonstrate how to log a point cloud.
Used Rerun types used-rerun-types
Logging and visualizing with Rerun logging-and-visualizing-with-rerun
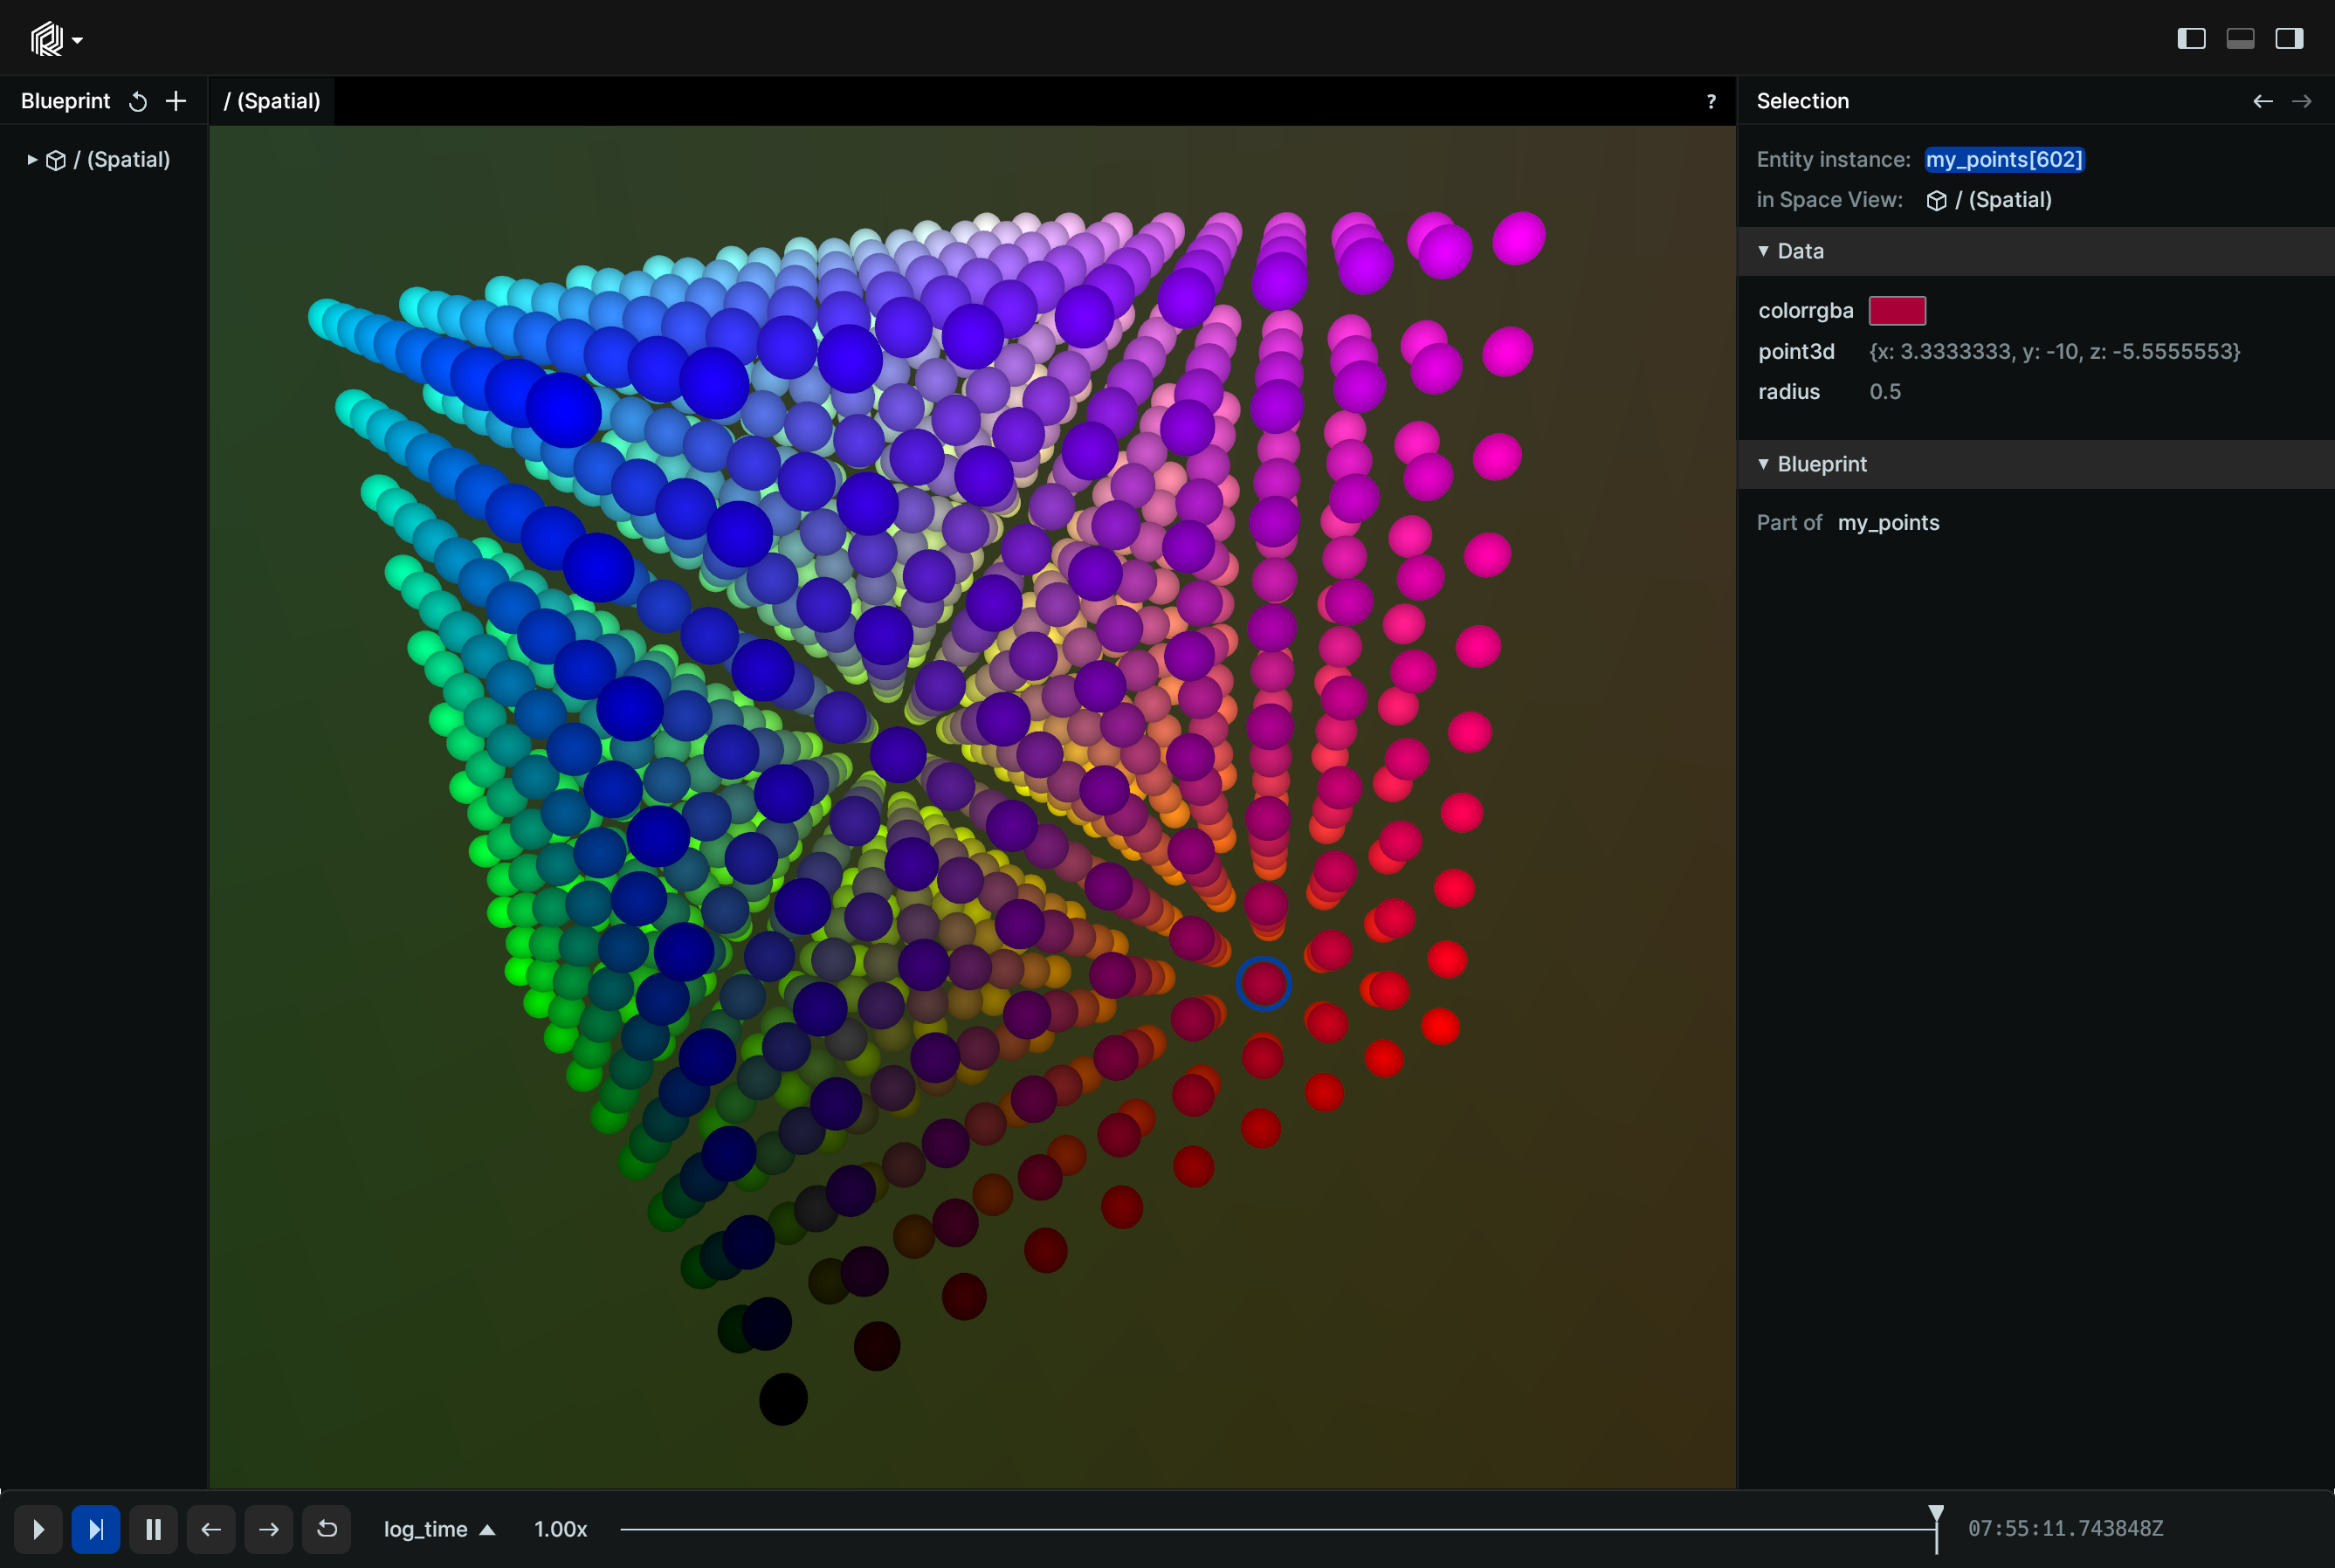
The visualizations in this example were created with the following Rerun code:
It logs 3D points, each associated with a specific color, forming a grid pattern using Points3D archetype.
import rerun as rr
import numpy as np

rr.init("rerun_example_my_data", spawn=True)

SIZE = 10

pos_grid = np.meshgrid(*[np.linspace(-10, 10, SIZE)] * 3)
positions = np.vstack([d.reshape(-1) for d in pos_grid]).T

col_grid = np.meshgrid(*[np.linspace(0, 255, SIZE)] * 3)
colors = np.vstack([c.reshape(-1) for c in col_grid]).astype(np.uint8).T

rr.log("my_points", rr.Points3D(positions, colors=colors, radii=0.5))
Run the code run-the-code
To run this example, make sure you have the Rerun repository checked out and the latest SDK installed:
pip install --upgrade rerun-sdk  # install the latest Rerun SDK
git clone git@github.com:rerun-io/rerun.git  # Clone the repository
cd rerun
git checkout latest  # Check out the commit matching the latest SDK release
Install the necessary libraries specified in the requirements file:
pip install -e examples/python/minimalTo experiment with the provided example, simply execute the main Python script:
python -m minimal # run the example