Robotics
Lidar
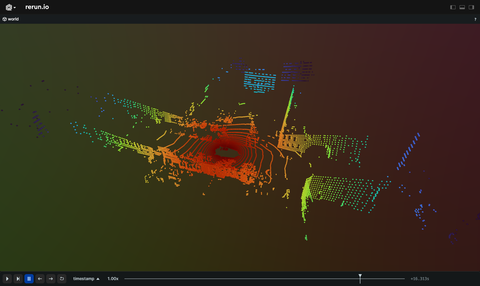
Visualize the LiDAR data from the nuScenes dataset.
Used Rerun types
Background
This example demonstrates the ability to read and visualize LiDAR data from the nuScenes dataset, which is a public large-scale dataset specifically designed for autonomous driving. The scenes in this dataset encompass data collected from a comprehensive suite of sensors on autonomous vehicles, including 6 cameras, 1 LIDAR, 5 RADAR, GPS and IMU sensors.
It's important to note that in this example, only the LiDAR data is visualized. For a more extensive example including other sensors and annotations check out the nuScenes example.
Logging and visualizing with Rerun
The visualization in this example was created with just the following lines.
rr.set_time("timestamp", timestamp=sample_data["timestamp"] * 1e-6)  # Setting the time
rr.log("world/lidar", rr.Points3D(points, colors=point_colors))  # Log the 3D data
When logging data to Rerun, it's possible to associate it with specific time by using the Rerun's timelines.
In the following code, we first establish the desired time frame and then proceed to log the 3D data points.
Run the code
To run this example, make sure you have the Rerun repository checked out and the latest SDK installed:
pip install --upgrade rerun-sdk  # install the latest Rerun SDK
git clone git@github.com:rerun-io/rerun.git  # Clone the repository
cd rerun
git checkout latest  # Check out the commit matching the latest SDK release
Install the necessary libraries specified in the requirements file:
pip install -e examples/python/lidarTo experiment with the provided example, simply execute the main Python script:
python -m lidar # run the exampleIf you wish to customize it, explore additional features, or save it use the CLI with the --help option for guidance:
python -m lidar --help