BarChart
A bar chart.
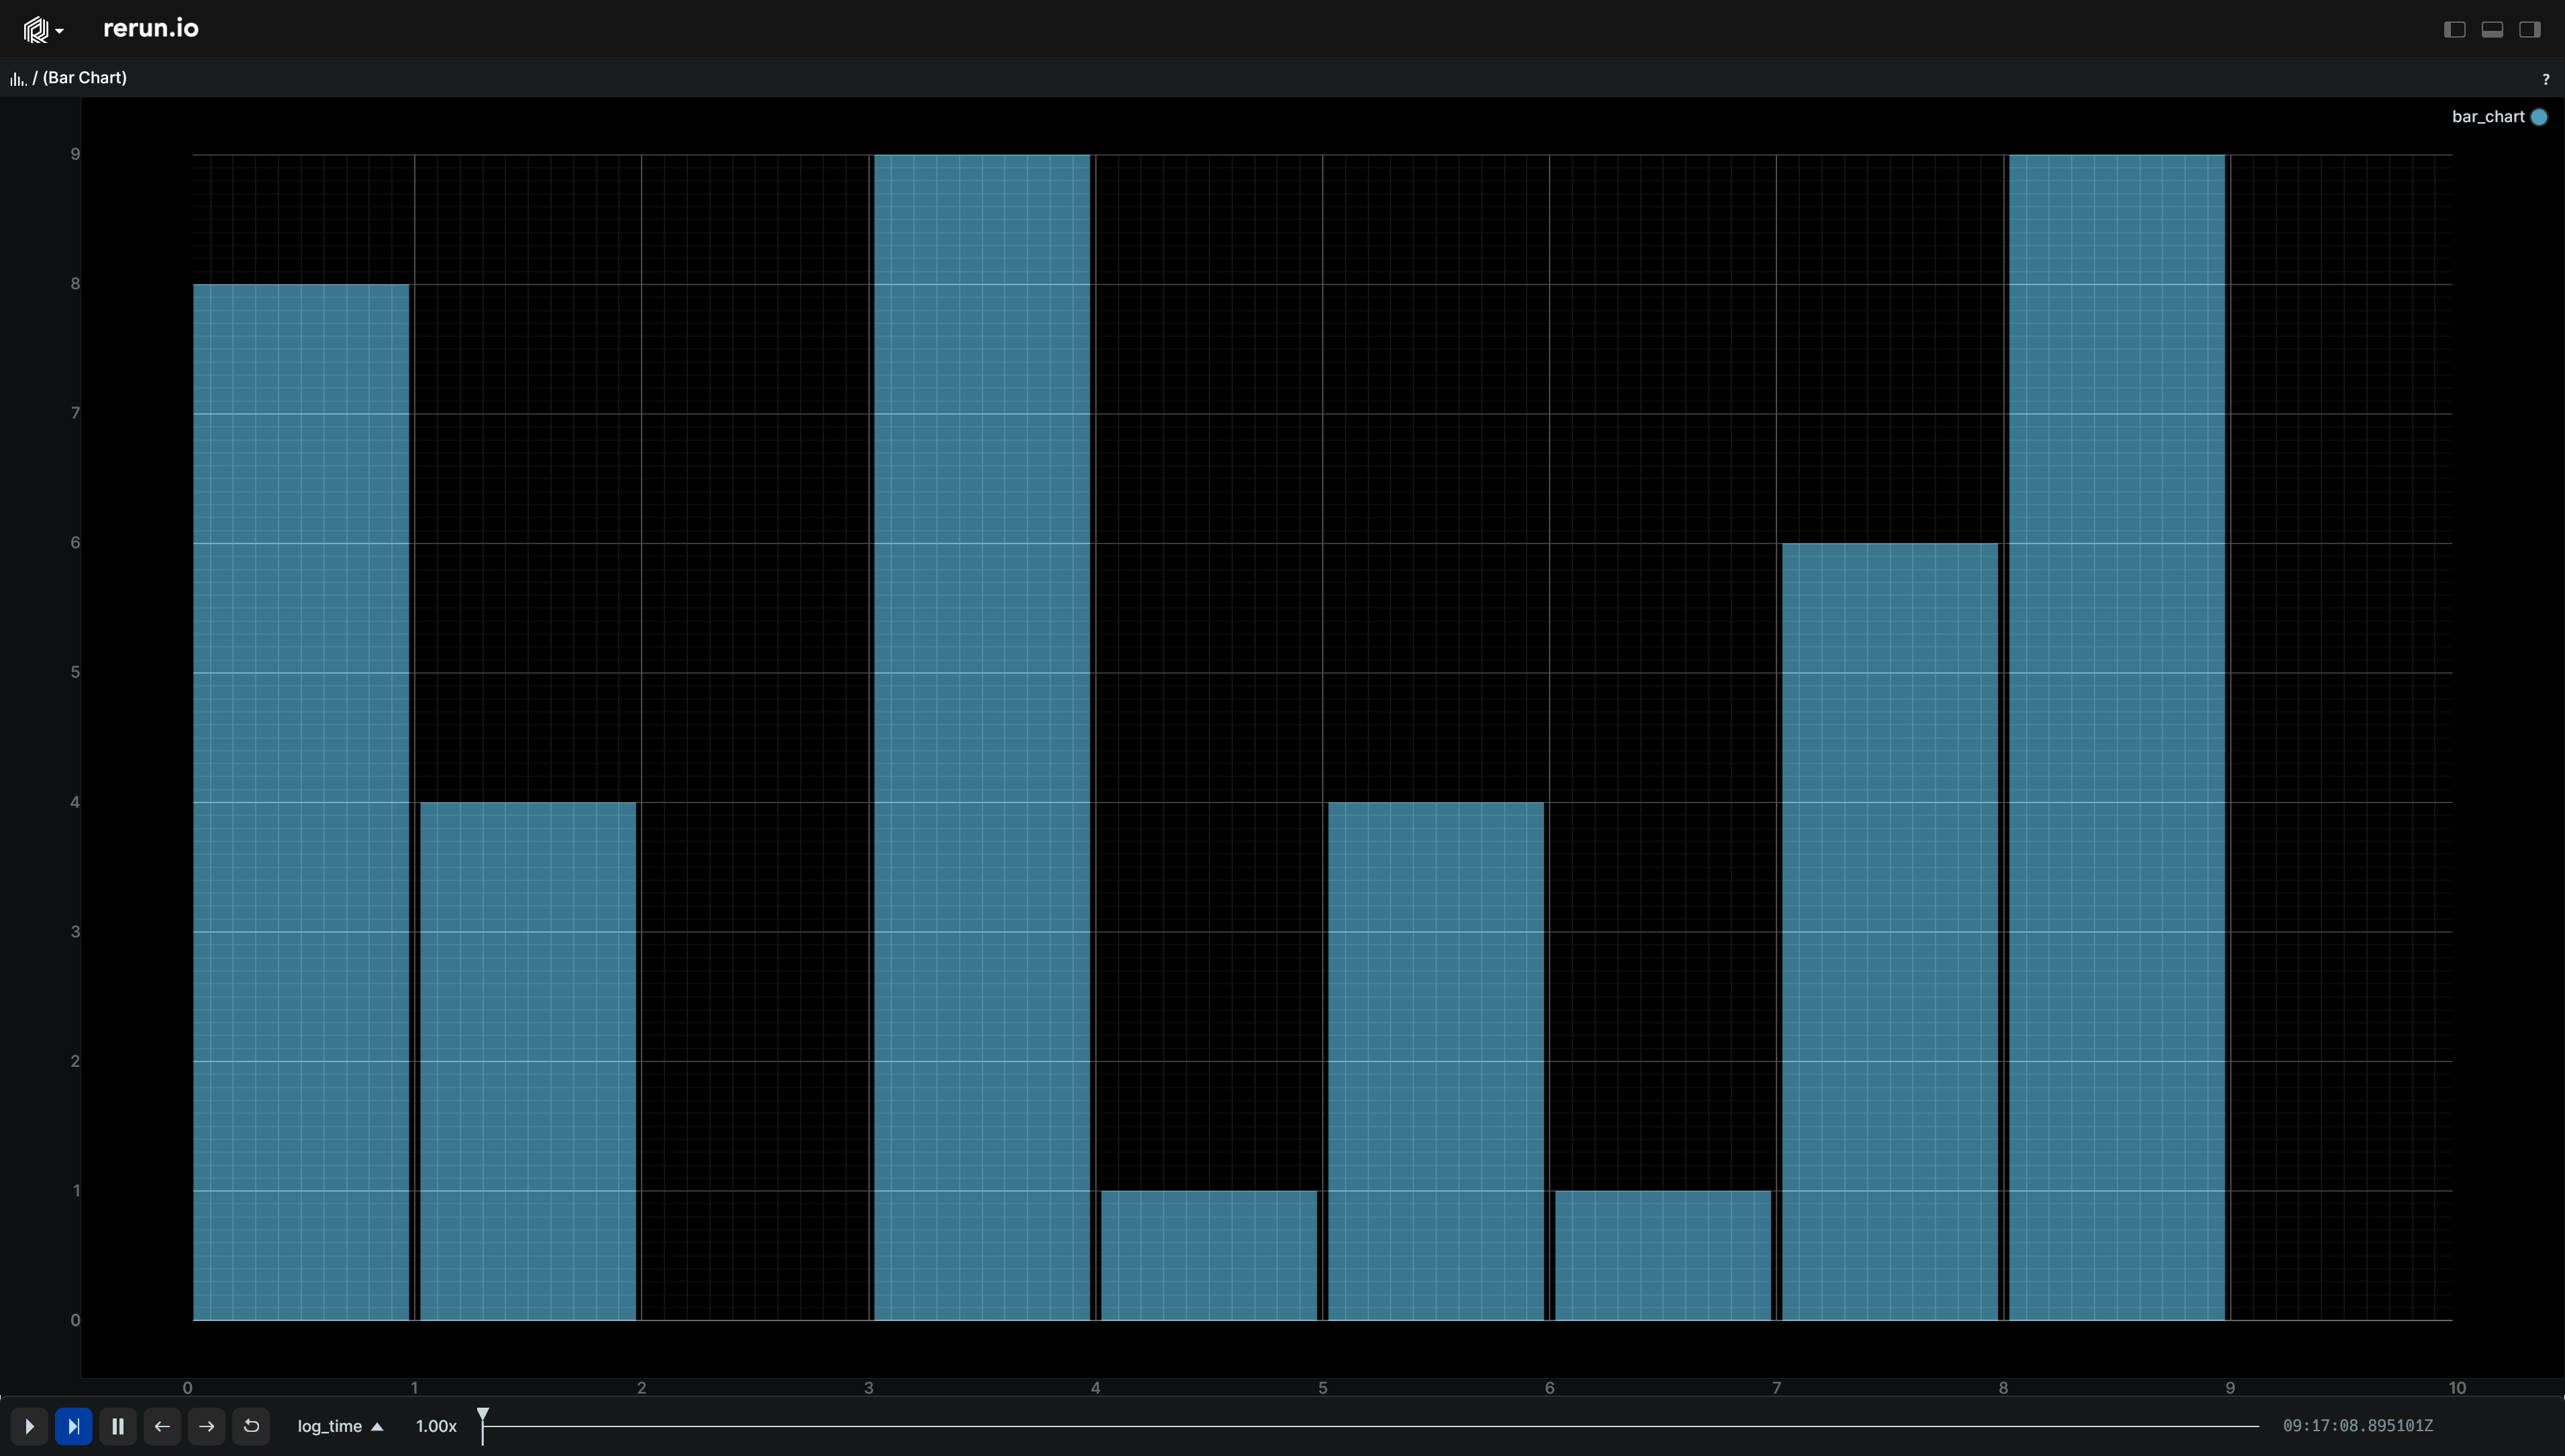
The x values will be the indices of the array, and the bar heights will be the provided values.
Components components
Required: TensorData
Optional: Color
Shown in shown-in
API reference links api-reference-links
Example example
Simple bar chart simple-bar-chart
"""Create and log a bar chart."""

import rerun as rr

rr.init("rerun_example_bar_chart", spawn=True)
rr.log("bar_chart", rr.BarChart([8, 4, 0, 9, 1, 4, 1, 6, 9, 0]))